In MetaTrader 4 you can see as many real time charts as you wish, all on one screen, for any currency pair or CFD and for any time period. The following types of trading charts are available in MetaTrader 4:
Line Chart. Chart x-axis is for the different time periods (minutes, hours, days, months etc.), and y-axis is for the price. The point on the chart shows the close price for the period, i.e. the bid of the last quote for this period. All the sequential points are joined by lines (Pic. 18):
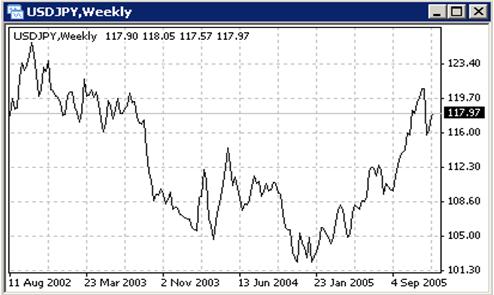
It is recommended that this chart type is used only for the short time periods (up to 5 minutes). In order to change the chart to a line chart, press the  button on the «Charts» toolbar (Pic. 19):

or press the Alt+3 key combination or use the Charts -> Line Chart menu sequence.
Bar Chart. The chart is created with the use of bars. Each bar has a high (top), a low (bottom), an opening price (left horizontal little line) and a closing price (right horizontal little line) for the specified period of time (for example, an hour):
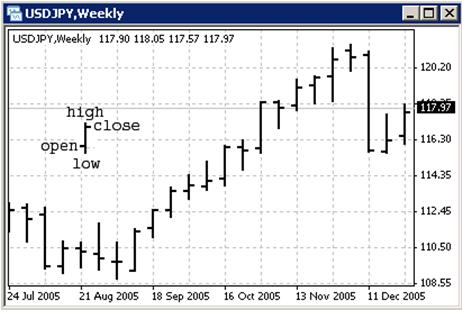
It is recommended that you use this chart type for periods of 5 minutes or more. In order to change the chart to a bar chart press the  button on the "Charts" toolbar.

or press the Alt+1 key combination, or use the Charts -> Bar Chart menu sequence.
Candlesticks. These charts are created in the same way as bar charts(Pic. 21):
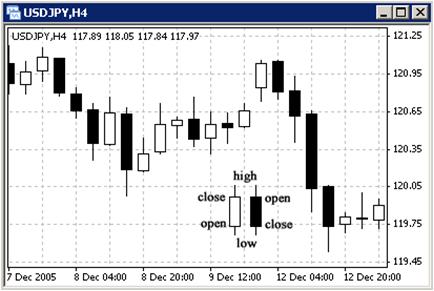
Candlesticks charts were very popular in the 80-90s because of their clear graphics. Candlesticks were originally created only for day charts. These days they are mostly used for a daily period. This method of technical analysis is based on the correlation between both closing and opening prices within the same trading day, and the closing price of the previous session and the opening price of the next session.
Candlesticks have different configurations compared to bar charts. The rectangular part of the candlestick line is called a real body. The thin vertical lines above and below the body are called shadows. They show lows and highs within a specified period of time. Depending on the closing and opening prices the real body can be white (empty) or black. When the body is white, the closing price is higher than the opening level. When the body is black, the closing price is lower than the opening level.
In order to create a candle chart press the  button on the "Charts" toolbar:

or press the Alt+2 keys simultaneously, or use the Charts -> Candlesticks menu sequence. In MetaTrader 4 both the bar and candle high is the highest Bid price for the defined period, the low is the lowest Bid price, the closing price is the last quoted Bid, the opening price is the first quoted Bid.
In order to create a new chart for any instrument right click on the "Market Watch" window, then select the Chart window item from the context menu:
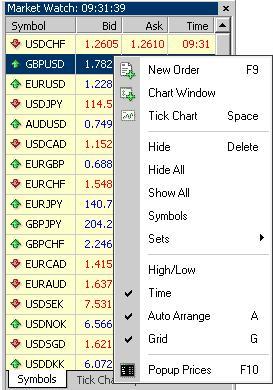
By left clicking the mouse you can drag and drop any selected currency pair or CFD into any open chart window.
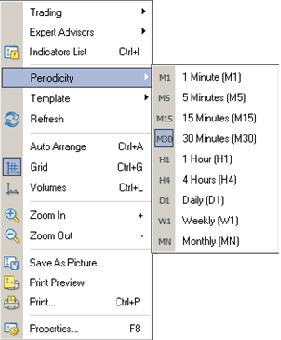
Chart period – the period displayed in one bar or candle. For example, if you create a 15 minute bar chart, then each bar will have the price data for the relevant 15 minutes. In MetaTrader 4 the following time periods can be used: 1, 5, 15, 30 minutes (M1, M5, M15, M30 respectively), 1 hour (H1), 4 hours (H4), 1 day (D1), 1 week (W1) and 1 month (MN). In order to change a time period, use the "Periodicity" toolbar:

Right click anywhere on the chart to produce the context menu to get access to the chart settings:
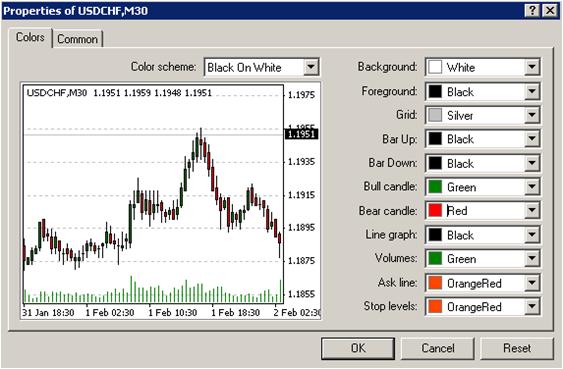
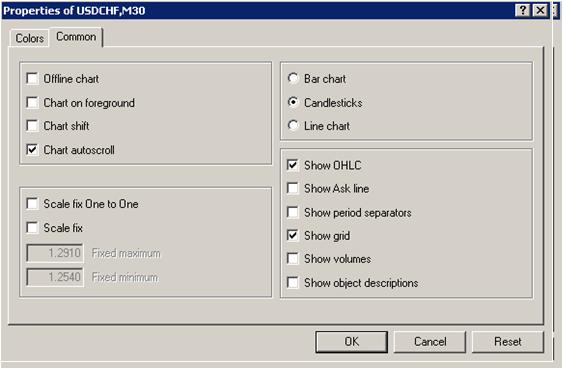
Other settings can be changed in the Common tab:
